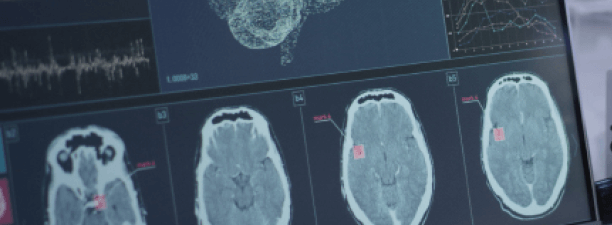

What Is Brain Mapping?
At Hills Neuroscience, we use cutting-edge technology to design a unique treatment plan based on your brain activity. Quantitative Electroencephalography (qEEG), or brain mapping, assesses the electrical activity produced by neurons (cells of the brain). When the brain cells communicate, they cause a confluence of electrical activity, which shows up as brainwaves. This electrical activity is recorded and analyzed to assess how your brain functions and how it may influence your symptoms and problematic behaviors.
Analyzing the EEG
Brain mapping starts with analyzing the EEG and removing artifacts. For example, we remove eye movements because they interfere with the correct interpretation of frontal sites.
Performing Spectral Analyses
We transform the data into its separate components and perform spectral analyses. This process allows us to analyze the brainwaves in their discrete frequency bands (Delta, Theta, Alpha, Beta, Gamma).
Generating Topographic Brain Maps
Topographic brain maps are generated, reflecting the frequency localization for each brainwave band. A spectral power analysis is compared to a symptom-free population and identifies brainwave activity as normal, excess, or deficient.
Analyzing Brain Network Connections
Brain connectivity describes the networks of functional and anatomical connections across the brain. We analyze the connections between brain regions to identify whether your brain is doing too much of one thing (being stuck) or not enough of another (disconnected). These types of network connections can contribute to cognitive, emotional, or behavioral difficulties.
Evaluating Left and Right Hemispheres
We look at the left and right hemisphere values to identify if they are different from each other (asymmetry). One type of frontal lobe asymmetry can contribute to depressive symptoms.
Interpreting Ratios of Brainwaves
We interpret ratios of specific brainwaves and use these as neuro markers for different disorders. For example, some people with ADHD show a theta/beta ratio above 4:1.
Comparing Your Brainwaves to Others
We then compare your brain to a normative database to identify any statistically significant differences between your brainwaves and others your age. If significant differences exist, we evaluate the findings and assess whether these differences contribute to your symptoms.
Assessing Deeper Brain Structures
sLORETA images (EEG superimposed on an MRI) allow us to assess deeper brain structures, such as the limbic system. We can locate where a specific brainwave is being generated.
Linking Brain Functioning to Symptoms
After the maps are interpreted, we provide 20-30 pages of graphs, tables, and maps, and we summarize the brainwave activity in simple terms. We also provide an interpretation and link your brain functioning to your symptoms.
Continued Monitoring
We continue to monitor brainwave changes and progress with repeated qEEG and other assessments as needed.
How Brain Mapping Helps


Did you know?
- In 2013, qEEG identified slow wave activity in frontal lobes was established as a biomarker for ADHD by the FDA.
- People with PTSD show changes in their EEG patterns identified by qEEG.
- qEEG shows an increase of beta and/or a decrease of alpha frequencies in many people with alcoholism.
- Brain mapping shows disruptions, including increases in beta power, theta, and alpha frequency power with chronic pain conditions.
- qEEG can assess a patient after a stroke or TBI, identifying problem areas and protocols to increase functioning.
- Brain mapping can illuminate brainwave patterns that might contribute to you not functioning at peak performance.
- qEEG can also help us identify when your brain is in a flow state.
- qEEGs showed abnormalities in brain activity among Covid-19 patients, including the slowing of brainwaves, some abnormal rhythmic patterns, and epileptic-like spikes.
If your brain activity is dysregulated, your brain function may be compromised. The qEEG may identify abnormalities in brain functioning that neurostimulation, pulsed electromagnetic field stimulation, and neurofeedback might help treat. We use the qEEG to guide specific protocols to address your unique challenges. We also use qEEG to optimize your brain functioning for peak performance.
CONDITIONS TREATED
Brain mapping will help guide your treatment.
-
TRAUMA & PTSD
-
SUBSTANCE USE DISORDERS
-
CHRONIC PAIN
-
PERFORMANCE ENHANCEMENT
-
DEPRESSION
-
ANXIETY
-
ATTENTION-DEFICIT/HYPERACTIVITY DISORDER (ADHD)
-
TRAUMATIC BRAIN INJURY (TBI)
-
CHRONIC STRESS
-
BURNOUT
-
BIPOLAR DISORDER
-
STROKE & TRANSIENT ISCHEMIC ATTACK (TIA)
-
OBSESSIVE COMPULSIVE DISORDER (OCD)
-
DISORDERED EATING AND BODY IMAGE, INCLUDING ANOREXIA, BULIMIA, BINGE EATING
-
COVID-19 NEUROLOGICAL SYMPTOMS
Schedule a Free Consultation
Contact us to schedule a free, 15-minute phone consultation to learn more and see if our integrative psychology services are right for you.
